Nonprofit Technology & Fundraising Blog
Subscribe to our mailing list
February 24, 2021 |

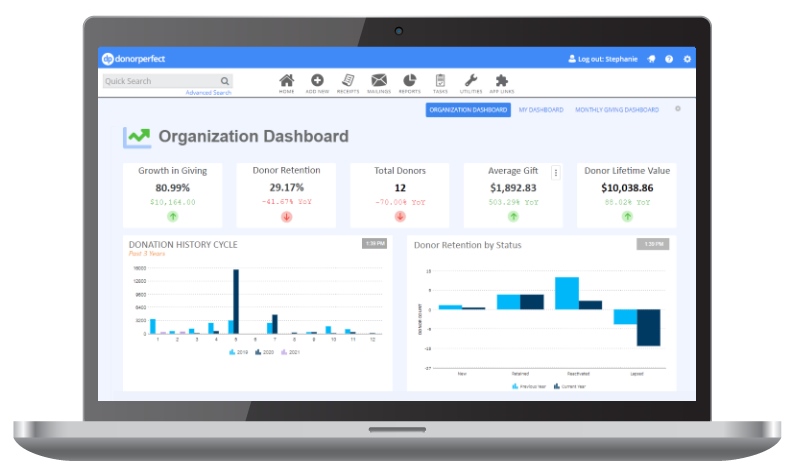
How well is your organization doing at fundraising? Are you attracting new donors, retaining existing donors, and increasing your donors’ lifetime value? Nonprofit KPIs (Key Performance Indicators) show how effectively your organization is achieving key fundraising goals. On a monthly or quarterly basis, you should review your fundraising metrics to evaluate your progress towards reaching your fundraising targets. In this month’s release of DonorPerfect, we’ve updated the Dashboard to help you assess the health of your organization’s fundraising and stay on top of important nonprofit KPIs.
In this blog post, we’ll cover:
DonorPerfect’s Dashboard available by clicking Reports > Dashboard off the main menu, provides real-time insights to measure your fundraising progress using key metrics. It includes over 25 customizable widgets to help you compare and track fundraising performance over time.
Starting this Friday evening (2/26), we’re updating the Dashboard to include these metrics:

NOTE: All of the Dashboard metrics listed above are evaluated on a year-over-year (YOY) basis and provide a rolling average based on the day viewed and not on any calendar or fiscal year setting.
The Growth in Giving tile displays the percentage increase or decrease for overall fundraising dollars for the current year vs. the previous year. It also tracks the change in total dollars this year compared to last year. This metric measures how effectively you attract new donors, retain existing donors and increase your donors’ annual giving amounts.
To grow your overall giving, apply growth-oriented fundraising strategies that increase revenue and reduce expenses. Here are a few ways to get started:
The Donor Retention tile shows the percentage of donors who gave this year and also gave last year. It also tracks the change in your donor retention rate this year compared to last year. The Donor Retention Status chart tracks new, retained, reactivated, and lapsed donor progress.
The average donor retention rate is 43%. If your donor retention rate falls below the industry average or it’s declining overall, there are steps you can take to improve it. First, review how you are acknowledging gifts. Is it a timely process? How are you staying in touch with donors after you acknowledge their contribution? Review your stewardship plan to make sure it includes enough touchpoints to boost donor engagement following a donation.
To increase donor retention:
The Donor Lifetime Value tile on DP’s Dashboard estimates how much revenue you expect a donor to contribute during their giving relationship with your organization. It takes into account how long a donor stays with your nonprofit and how often they contribute. The more regularly a donor contributes, the greater their value to your organization.
Donor Lifetime Value becomes even more valuable when you sort donors by specific appeals, communications channels, or categories, such as alumni. This can help you determine where your most valuable donors come from and the best way to reach them. Spending more time cultivating for donors with the highest DLV will result in higher revenue for your organization.
The Fundraising Effectiveness Project reports that 55% of donors who give to your organization once won’t give again. To get donors to contribute more frequently, follow these tips:
The Average Gift tile on DP’s Organization Dashboard displays the average gift amount of all gifts over the last 12 months and the change in your annual average gift amount this year compared to last year.
Since the average gift can fluctuate, it’s best to track this metric at fixed times, such as at specific intervals of the year or before and after a fundraising appeal or event.
Average gift is closely tied to other metrics, such as an increase or decrease in Total Donors. Monitoring these metrics together can help you focus your cultivation efforts. For example, if your number of total donors is growing, but your average gift amount decreases, steward existing donors to increase their giving amounts instead of getting new donors.
Nonprofits Source indicates that the average online donation is $128. How do you compare? Is your average gift amount increasing over time? If not, try these tips to boost your gift amounts:
The Total Donors tile shows the distinct donor count of active donors in the last 12 months and the change in total donors this year compared to last year. This includes new donors that you may have gained within the last 12 months and existing donors who gave again in the current year.
As mentioned above, Total Donor growth is closely tied to other key fundraising metrics. If Total Donors is down, it means you’re either not retaining your existing donors or gaining enough new donors to replace the supporters who’ve left.
If your total number of donors declines, you should:
If you don’t see the fundraising tiles mentioned in this article on your Organization’s Dashboard or in My Dashboard, you can add them now. Read Customizing Your Dashboard to learn how to add these widgets to monitor your fundraising metrics.
Adding Nonprofit KPIs to the DonorPerfect Fundraising Metrics Dashboard is not the only improvement in this release. Read about all the enhancements in the DonorPerfect 2021.02 Release Notes in the Knowledgebase in DP Community.
Follow us on social!